

Report
Democracy Report Card
Overview
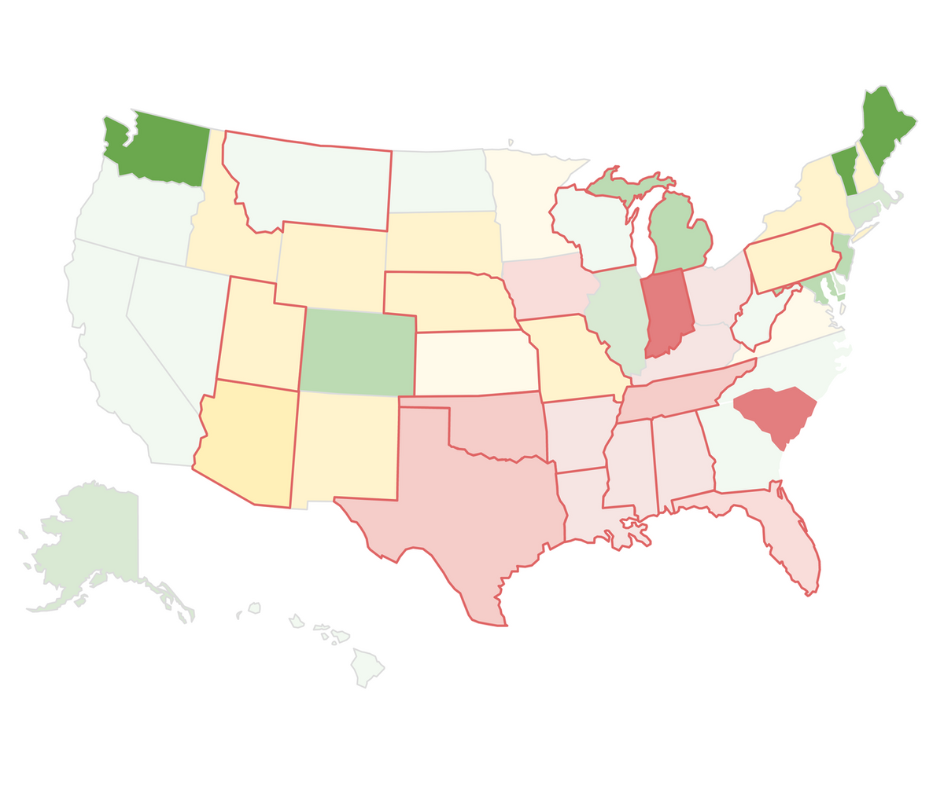
The 2022 Leadership Now Project Democracy Report Card helps business leaders make informed decisions about engaging in state-level politics and democracy reform.
The report card assigns a letter grade to each state based on their democratic performance across three critical categories; voting, electoral systems, and campaign finance. By evaluating the highest priority components of each category, this tool is a highly digestible, high-level view of state-level democracy.
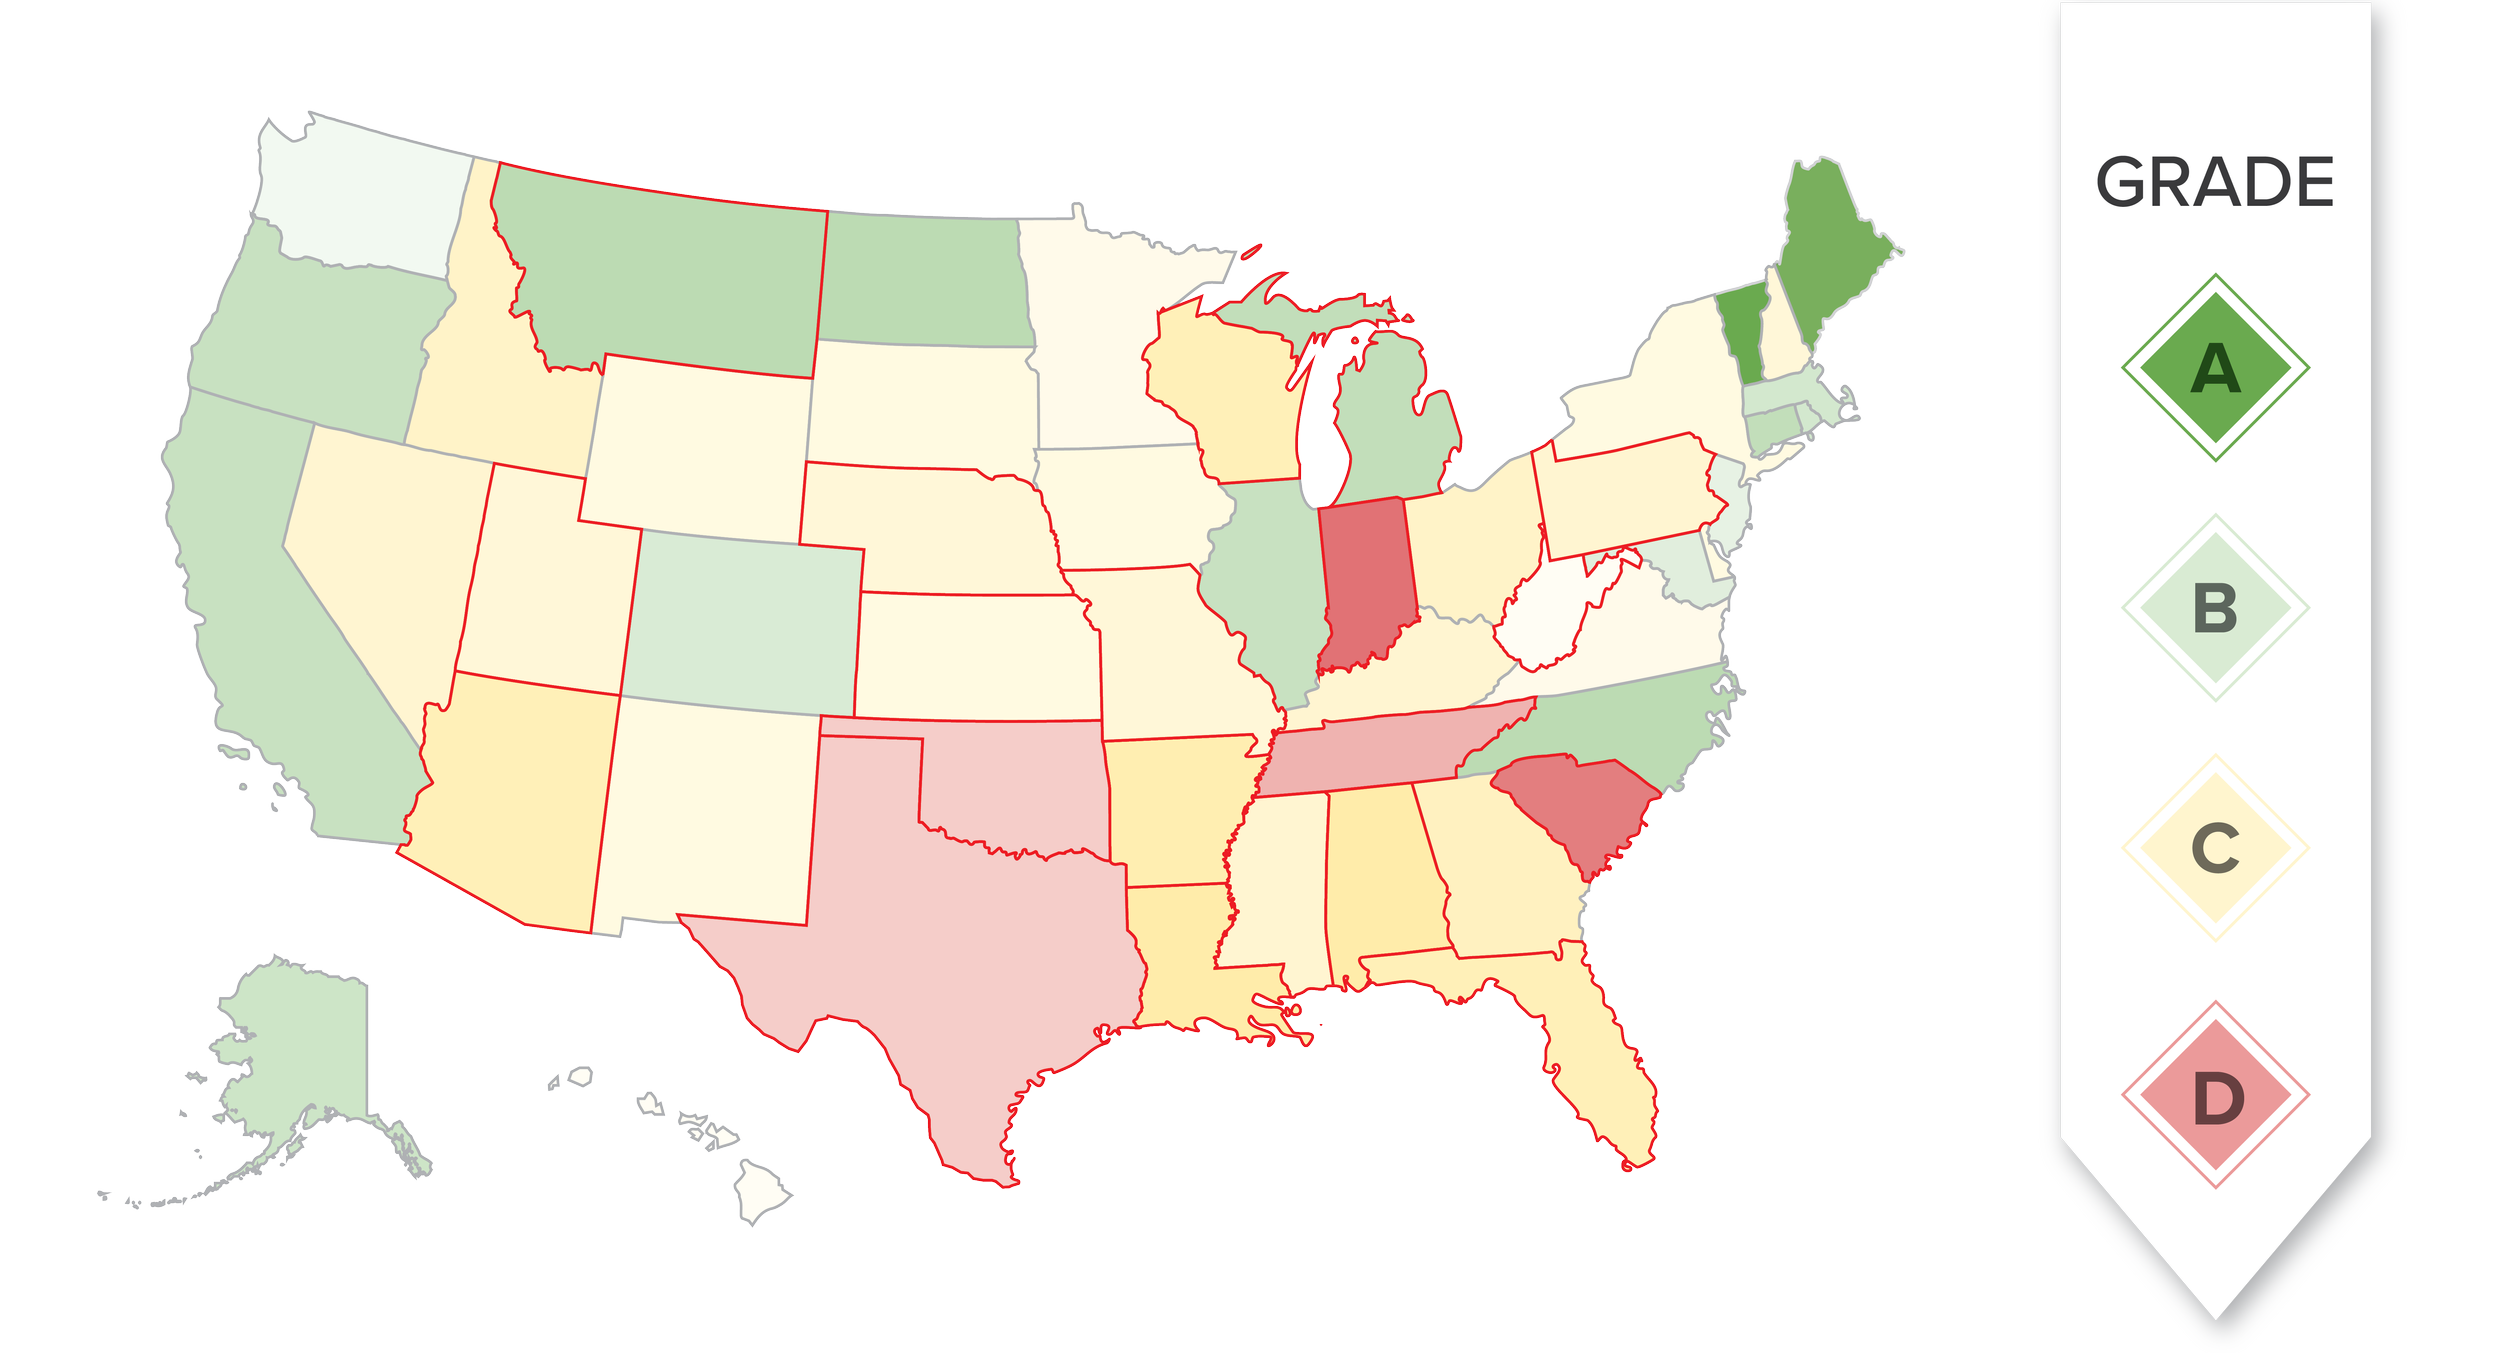
Detailed Scores by State
Click below for a breakdown of each state’s results.
AK | AL | AR | AZ | CA | CO | CT | DE | FL | GA | HI | IA | ID | IL | IN | KS | KY | LA | MA | MD | ME | MI | MN | MO | MS | MT | NC | ND | NE | NH | NJ | NM | NV | NY | OH | OK | OR | PA | RI | SC | SD | TN | TX | UT | VA | VT | WA | WI | WV | WY
Key Takeaways
- Each state can make significant improvements in its law that would enhance its performance as a democracy. Most states rank poorly, with the majority receiving a “C” grade
- Many aspects of a state’s democratic performance are tied together; addressing one issue can lead to improvements in other aspects of a state’s performance
- Challenges in democratic performance aren’t endemic to either red or blue states; it is crucial for policymakers to take action in all states to make our elections more secure, modern, accessible and transparent. This is not a federal-level critique of red states; it’s a state-by-state analysis with the hope of encourages states to get better among their peers
Methodology
This tool assigns a grade for each state’s performance in voting, electoral systems, and campaign finance. To determine an overall grade, the grades for each category are weighted evenly to take an average.
Within each category, approximately five metrics were identified and vetted. Within each metric, states were power-ranked to determine a grade. A state ranked first received 100% (an A) whereas a state ranked 25th received 75% (a C).
Outside of scoring, states are highlighted for their risk level for election subversion leveraging Bloomberg’s Election Risk Index. Bloomberg’s analysis identifies which state elections are most vulnerable to political interference and attempts to overturn the public votes.
You Might Also Like

Insights & Statements